viewof bins = Inputs.range([5, 100], {value: 30, step: 5, label: "Bins:"})

data = transpose(hist_data)

Plot.plot({
  marks: [
    Plot.rectY(data, Plot.binX({y: "count"}, {
      x: d => d.value,
      thresholds: bins,
      fill: "steelblue",
      stroke: "black"
    }))
  ],
  style: {background: "transparent", color: "white", fontSize: 18}
})Quarto in 300 Seconds
Andrey Höglund
2026-06-29
Quarto is a software tool that . . .
- Interactive reports
- Computation inside the file!
- Written in
Markdownformat Inline code- Open-source
viewof species = Inputs.checkbox(
  ["setosa", "versicolor", "virginica"],
  {value: ["setosa", "versicolor", "virginica"], label: "Species:"}
)

idata = transpose(iris_data)
filtered = idata.filter(d => species.includes(d.Species))

colors = ({setosa: "steelblue", versicolor: "orange", virginica: "mediumseagreen"})

Plot.plot({
  marks: [
    Plot.boxY(filtered, {
      x: d => d.Species,
      y: d => d["Sepal.Length"],
      fill: d => d.Species,
      stroke: "black"
    })
  ],
  x: {label: "Species"},
  y: {label: "Sepal Length"},
  color: {range: ["steelblue", "orange", "mediumseagreen"]},
  style: {background: "transparent", color: "white", fontSize: 16},
  marginBottom: 40,
  marginLeft: 50
})
1. The Anatomy of a Quarto file
The Anatomy of a Quarto file
The Anatomy of a Quarto file
report_file.qmd
- YAML header (file’s meta data)
The Anatomy of a Quarto file
report_file.qmd
- YAML header (file’s meta data)
- Markdown
The Anatomy of a Quarto file
report_file.qmd
- YAML header (file’s meta data)
- Markdown
code chunks
2. Running code inside a Quarto file
Running code inside a Quarto file
Running code inside a Quarto file
script.R
Quarto renders a file in the same manner as a jupyter notebook
Running code inside a Quarto file
script.R
[1] 11Quarto renders a file in the same manner as a jupyter notebook
Running code inside a Quarto file
script.R
[1] 30.36364Quarto renders a file in the same manner as a jupyter notebook
Running code inside a Quarto file
script.R
[1] 334Quarto renders a file in the same manner as a jupyter notebook
Running code inside a Quarto file
script.R
Inline code - do some calculation and present in the text
Running code inside a Quarto file
script.R
We collected 11 measurements.
The average was 30.3636364.
And the total sum was 334.
Inline code - do some calculation and present in the text
Running code inside a Quarto file
script.R
Inline code - do some calculation and present in the text
Running code inside a Quarto file
script.R
We collected 22 measurements.
The average was 32.9090909.
And the total sum was 724.
Inline code - do some calculation and present in the text
3. Version control - Git
Version control - Git
Version control is not track changes
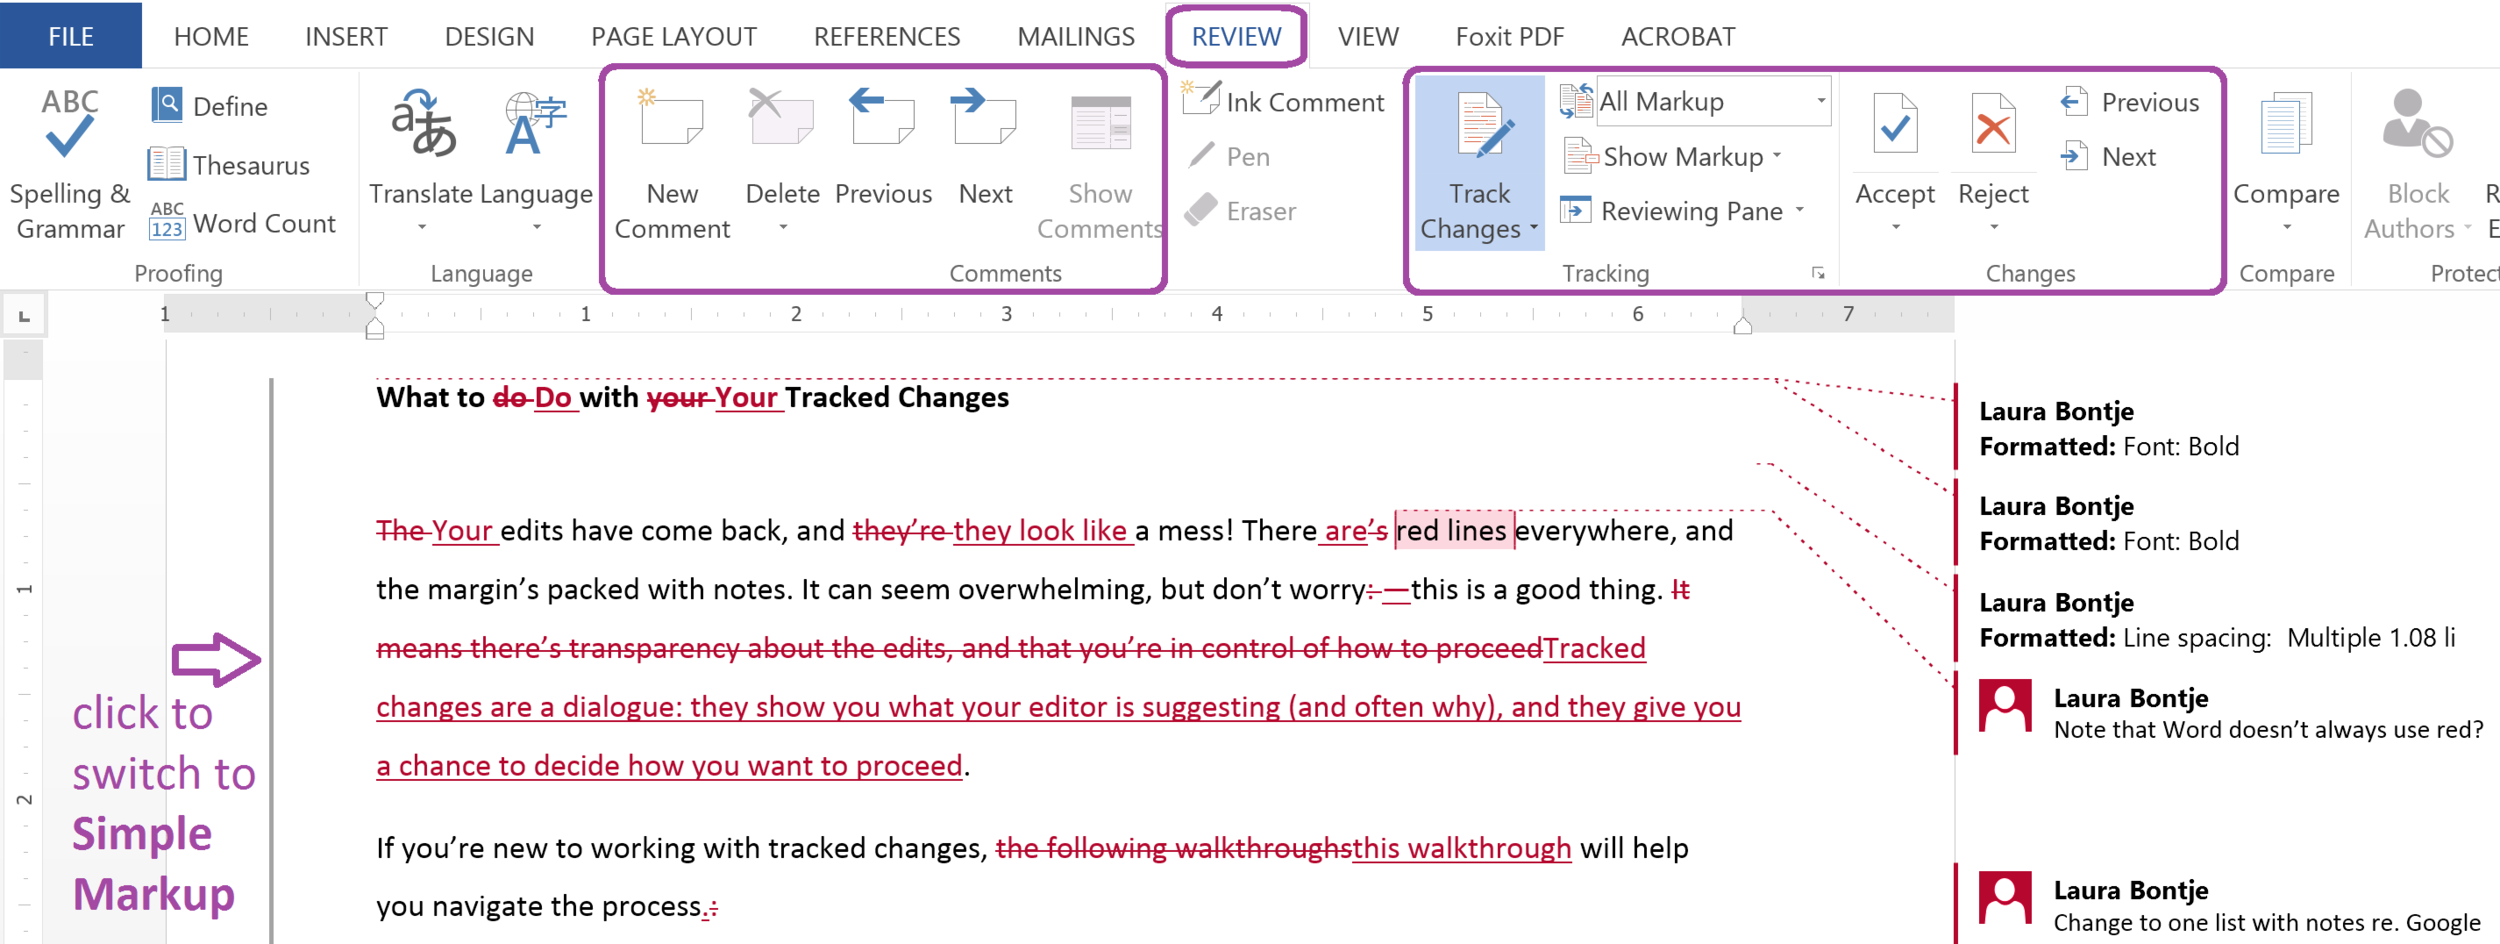
Version control - Git
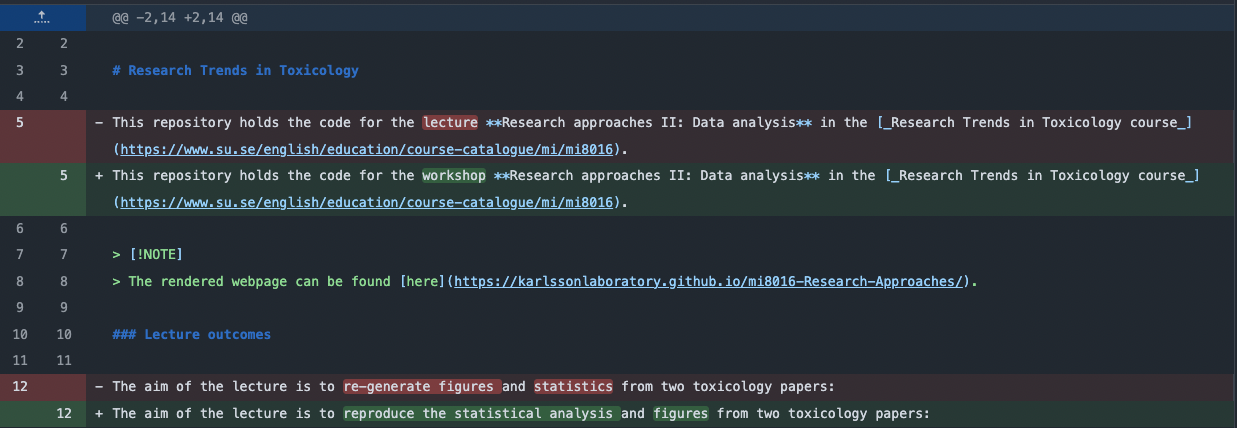
Since a Quarto file is plain text we can track all changes with version control
Conclusion

- Webpages
- Reports
- Presentations (like this one)
- Articles
- Your kappa?!
Github repo | Quarto in 300 Seconds